Good data in, good data out. The old rule of computing has never mattered more than now, when the grid leans on AI and load climbs faster than anyone can build new lines. Getting the most from the wires already in the ground relies on good data, and on analysis the people running the grid can trust.
So the data has to be right, and the operators have to see where it comes from. Before a line can carry more power, they need proof that a changed rating is precise, and not a black-box guess. Today’s static ratings cannot stretch that far, and the small gains from ambient adjusted ratings (AAR) will not close the gap either.
A new Prisma Photonics study does two things at once. It shows how much capacity the method frees up across three anonymized lines, and it proves the wind data behind those gains by checking the AI model against physical weather stations in the field.
Static line ratings leave transmission capacity unused
Demand is rising faster than anyone can build new transmission. Data centers and electrification keep pulling more load, and new wind and solar keeps arriving, while a fresh line takes years to permit and build.
So operators need more from the lines they already have. Dynamic Line Rating (DLR) offers exactly that, by rating a line on live conditions instead of a fixed worst-case assumption.
A static line rating stays close to one conservative number all season, picked for a hot day with little wind. Real weather is kinder most of the time, and wind-driven cooling is the biggest single factor in how much current a conductor can carry. When wind crosses the line and the static rating ignores it, you leave real transmission capacity unused.
The barrier has rarely been the physics. What stalls DLR is doubt about the wind data behind a higher rating. Before an operator runs more current, that wind input has to hold up against real measurement.
Two older DLR approaches each fall short on that test, which is why so many programs stall in a pilot and never scale.
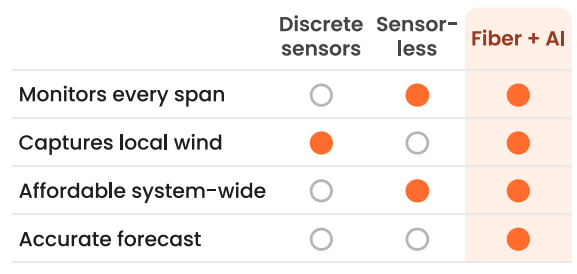
Only one column checks every box, and it rides on fiber many utilities already own.
Fiber-sensing and AI wind modeling on every span
Roughly half of the 600,000 miles of high-voltage transmission in the U.S. already carries optical ground wire, the OPGW cable along the top of the towers. Most of its fiber sits dark and unused.
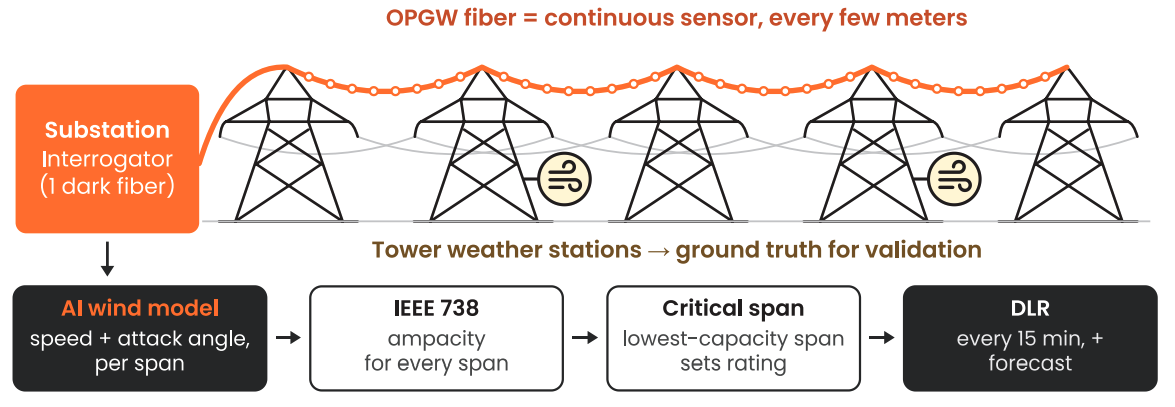
Prisma Photonics taps a single strand of that fiber. An interrogator unit in a substation sends light pulses down the line and reads the faint light that scatters back, a method called Distributed Acoustic Sensing, so the whole cable works as a continuous sensor every few meters rather than a handful of fixed points.
The system rates every span, then finds the critical span, the single least-favorable span that caps the safe limit for the whole line at that moment. The critical span moves hour to hour and season to season as weather shifts along the route, so the system rescans all spans every 15 minutes and forecasts ahead. Each span’s rating runs through the industry-standard equations (IEEE 738, with CIGRE Technical Brochure 601 as an equivalent).
AI-based wind modeling
Wind-driven cooling is the biggest single factor in a line’s rating, so the wind data has to be right. A purpose-built AI model turns the fiber signals into two values for every span: wind speed, and the angle at which the wind meets the conductor. The two combine into an effective wind, the figure that feeds the rating equations. Both inputs matter, so the model reads both.
Standard weather stations along the towers feed the model real measurements, and the model keeps training on that data, so its wind values sharpen over time.
Deployments: fiber-sensing DLR in the field
The study runs across three anonymized North American lines in very different wind climates, each measured against the utility’s own static or seasonal rating:
- High-wind line: about 50 miles, 230 kV, across windy flat ground
- Moderate-wind line: about 25 miles, 115 kV, over a mix of hills, water, and flat land
- Low-wind line: about 35 miles, 230 kV, in sheltered hilly terrain
Along each line, weather stations sit at regular intervals. The spans on either side of a station become test sites, where the model’s wind meets a direct check against the station’s own readings.
Validating AI-modeled wind against real weather data
The study measures two things across the three lines: how much extra capacity each one gains, and how closely the model’s wind readings match the real weather stations alongside them.
DLR capacity gains
The capacity that frees up tracked the wind, exactly as the physics implies. The high-wind line gained the most:
- High-wind line: 36% more transfer capacity
- Moderate-wind line: 18% more
- Low-wind line: 11% more
The timing helps you, because the windiest hours are when wind farms generate hard and corridors clog. The extra room lands right when the system needs it.
Wind-model validation
A capacity gain is only as good as the wind data under it, so the study checked the model’s wind readings against the tower weather stations at every test site.
On the high-wind line, the model’s wind-speed readings tracked the stations at a 0.94 correlation, meaning the two readings were indistinguishable about 94% of the time. The average error came to 0.54 m/s, a touch over one mile per hour.
One comparison should land with any skeptic. Two physical weather stations a span apart already differ from each other by about 0.5 m/s, so the model reads the wind about as closely as one real station reads against another.
Accuracy eased off a little where wind was scarcer, as you would expect from a model that learns from data. The moderate and low-wind lines still correlated at 0.90 and 0.89 on wind speed. Wind direction is harder to pin down in light, shifting air, yet the average error held within roughly 10 degrees on every line.
The payoff reaches past a higher rating. The same validated wind data supports three more jobs:
- Auditable DLR at scale: a handful of weather stations vouch for every span in between, with no hardware on the line
- Better planning, operations, and markets: sharper forecasts flag congestion early, feed cleaner day-ahead and hour-ahead signals, and support FERC Order 881 work
- Grid-weather data beyond ratings: line-level weather along the full corridor becomes an asset for resilience as extreme weather hits the grid harder each year
Find out what your lines can really carry
For years, DLR asked operators to take the capacity gains on faith. The Prisma Photonics study changes the terms, pairing a real number, up to 36% more transfer capacity, with proof that the wind data behind it matches physical instruments on the tower.
If you run transmission and suspect your static ratings are leaving power on the line, the next move is small. Prisma Photonics can read the fiber you already own, rate every span, and show you the headroom in your own network, with weather stations on hand to check the work.
Talk to Prisma Photonics about what span-level, auditable DLR could free up on your lines.